
Robust linear estimator fitting
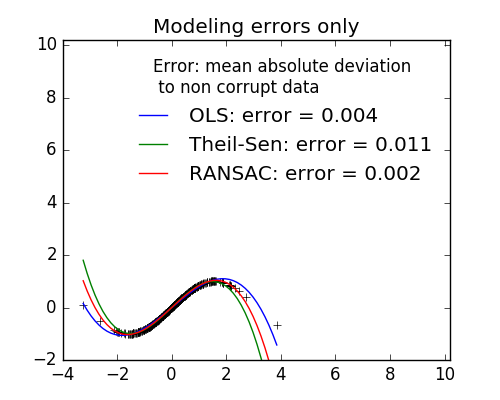
Here a sine function is fit with a polynomial of order 3, for values close to zero.
Robust fitting is demoed in different situations:
- No measurement errors, only modelling errors (fitting a sine with a polynomial)
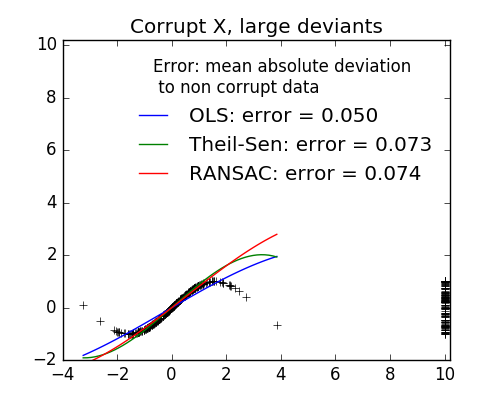
- Measurement errors in X
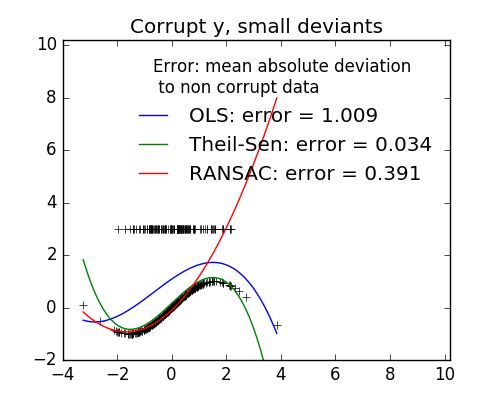
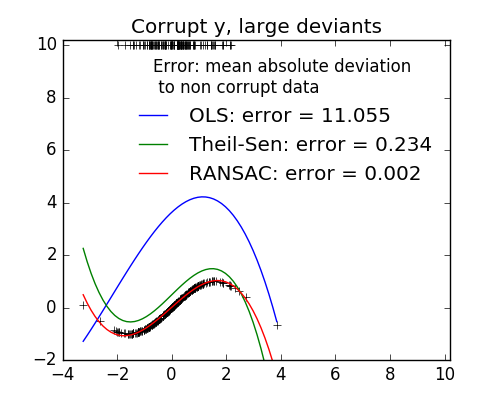
- Measurement errors in y
The median absolute deviation to non corrupt new data is used to judge the quality of the prediction.
What we can see that:
- RANSAC is good for strong outliers in the y direction
- TheilSen is good for small outliers, both in direction X and y, but has a break point above which it performs worst than OLS.

Python source code: plot_robust_fit.py
from matplotlib import pyplot as plt
import numpy as np

from sklearn import linear_model, metrics
from sklearn.preprocessing import PolynomialFeatures
from sklearn.pipeline import make_pipeline

np.random.seed(42)

X = np.random.normal(size=400)
y = np.sin(X)
# Make sure that it X is 2D
X = X[:, np.newaxis]

X_test = np.random.normal(size=200)
y_test = np.sin(X_test)
X_test = X_test[:, np.newaxis]

y_errors = y.copy()
y_errors[::3] = 3

X_errors = X.copy()
X_errors[::3] = 3

y_errors_large = y.copy()
y_errors_large[::3] = 10

X_errors_large = X.copy()
X_errors_large[::3] = 10

estimators = [('OLS', linear_model.LinearRegression()),
              ('Theil-Sen', linear_model.TheilSenRegressor(random_state=42)),
              ('RANSAC', linear_model.RANSACRegressor(random_state=42)), ]

x_plot = np.linspace(X.min(), X.max())

for title, this_X, this_y in [
        ('Modeling errors only', X, y),
        ('Corrupt X, small deviants', X_errors, y),
        ('Corrupt y, small deviants', X, y_errors),
        ('Corrupt X, large deviants', X_errors_large, y),
        ('Corrupt y, large deviants', X, y_errors_large)]:
    plt.figure(figsize=(5, 4))
    plt.plot(this_X[:, 0], this_y, 'k+')

    for name, estimator in estimators:
        model = make_pipeline(PolynomialFeatures(3), estimator)
        model.fit(this_X, this_y)
        mse = metrics.mean_squared_error(model.predict(X_test), y_test)
        y_plot = model.predict(x_plot[:, np.newaxis])
        plt.plot(x_plot, y_plot,
                 label='%s: error = %.3f' % (name, mse))

    plt.legend(loc='best', frameon=False,
               title='Error: mean absolute deviation\n to non corrupt data')
    plt.xlim(-4, 10.2)
    plt.ylim(-2, 10.2)
    plt.title(title)
plt.show()
Total running time of the example: 14.00 seconds ( 0 minutes 14.00 seconds)