sklearn.metrics.roc_curve
-
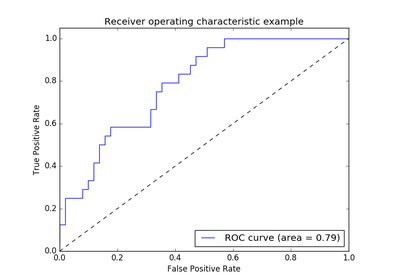
sklearn.metrics.roc_curve(y_true, y_score, pos_label=None, sample_weight=None, drop_intermediate=True)[源代码]¶ Compute Receiver operating characteristic (ROC)
Note: this implementation is restricted to the binary classification task.
Read more in the User Guide.
Parameters: y_true : array, shape = [n_samples]
True binary labels in range {0, 1} or {-1, 1}. If labels are not binary, pos_label should be explicitly given.
y_score : array, shape = [n_samples]
Target scores, can either be probability estimates of the positive class or confidence values.
pos_label : int
Label considered as positive and others are considered negative.
sample_weight : array-like of shape = [n_samples], optional
Sample weights.
drop_intermediate : boolean, optional (default=True)
Whether to drop some suboptimal thresholds which would not appear on a plotted ROC curve. This is useful in order to create lighter ROC curves.
0.17 新版功能: parameter drop_intermediate.
Returns: fpr : array, shape = [>2]
Increasing false positive rates such that element i is the false positive rate of predictions with score >= thresholds[i].
tpr : array, shape = [>2]
Increasing true positive rates such that element i is the true positive rate of predictions with score >= thresholds[i].
thresholds : array, shape = [n_thresholds]
Decreasing thresholds on the decision function used to compute fpr and tpr. thresholds[0] represents no instances being predicted and is arbitrarily set to max(y_score) + 1.
参见
roc_auc_score- Compute Area Under the Curve (AUC) from prediction scores
Notes
Since the thresholds are sorted from low to high values, they are reversed upon returning them to ensure they correspond to both
fprandtpr, which are sorted in reversed order during their calculation.References
[R52] Wikipedia entry for the Receiver operating characteristic Examples
>>> import numpy as np
>>> from sklearn import metrics
>>> y = np.array([1, 1, 2, 2])
>>> scores = np.array([0.1, 0.4, 0.35, 0.8])
>>> fpr, tpr, thresholds = metrics.roc_curve(y, scores, pos_label=2)
>>> fpr
array([ 0. ,  0.5,  0.5,  1. ])
>>> tpr
array([ 0.5,  0.5,  1. ,  1. ])
>>> thresholds
array([ 0.8 ,  0.4 ,  0.35,  0.1 ])


